Z-score: The intuitive way
why normalization is necessary and how z-score allows better interpretation of data.
When working with big data, we often come across data in different formats in different datasets. Data standardization is the process of converting these different data formats into a common data format.
Let's see with an example when and how we can use Z-score to normalize our data.
example 1
Let us say Prof X teaches in two different classes and here's how the class scores look like:
Sec A: class avg is 55 marks, standard deviation 10 and student stud1 gets 65.
Sec B: class avg is 75 marks, standard deviation 10 and student stud2 gets 70.
From the first look we can see that stud2 has scored more than stud1. So if we have a standard grading system, stud1 gets 'B' while stud2 gets 'A'. If we however look closely, stud1 has scored above her class avg while stud2 has scored below her class average.
So it does not seem fair that stud2 still has better grades than stud1. Data normalization brings down our data to a much smaller range and gives a better comparison between how they are related.
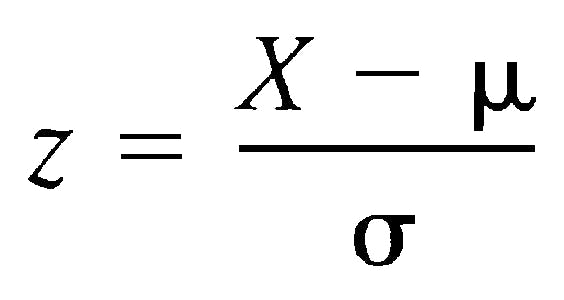
Here's the formula to calculate the Z- score.

μ = mean value of the feature σ = standard deviation of the feature
If a value is equal to μ, it will be normalized to 0. If it is below μ, it will be -ve number If it is above μ, it will be +ve number.
Let's see if Z-score of the students' marks gives us a better outlook on which student actually did well.
stud1:
- mean = 55
- marks = 65
- standard deviation = 10
- Z(stud1) = (65-55)/10 = 1.0
stud2:
- mean = 75
- marks = 70
- standard deviation = 10
- Z(stud2) = (70-75)/10 = -0.50
Since Z(stud1) > Z(stud2), we can clearly see that stud1 (65 marks) did better than stud2 (70 marks)
example 2
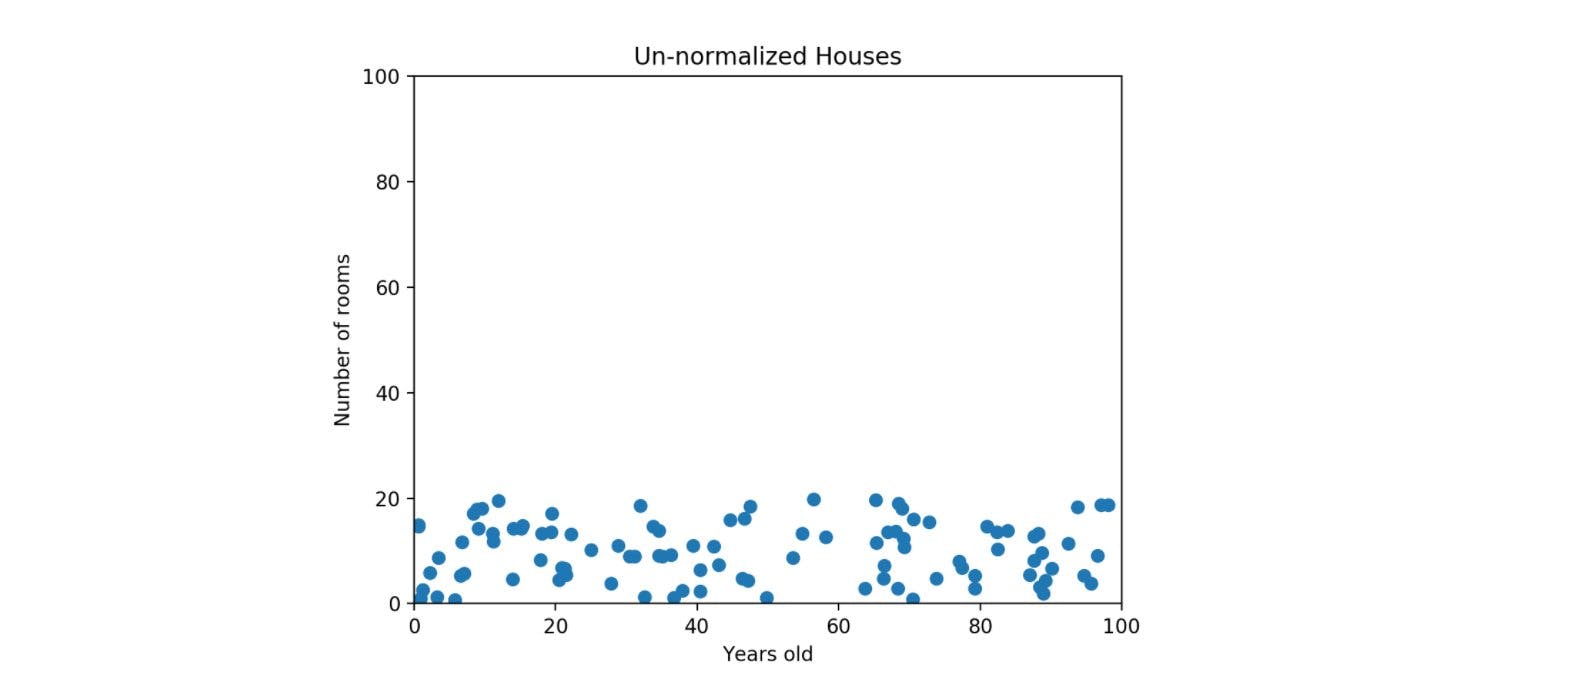
Let us now move on to a bigger example and see how Z-score makes a difference in how we plot our data points. Say, we are trying to plot a house's age with number of rooms in the house. The number of rooms will possibly range from 1 to 20, but the age of house might go upto 100 or even more. As we can see in the plot below, the feature with the larger scale (age of house in this case) will always dominate the graph

In the above graph we can see that there isn't much distinction between say, a house with 5 rooms & a house with 20 rooms if they are of the same "age".
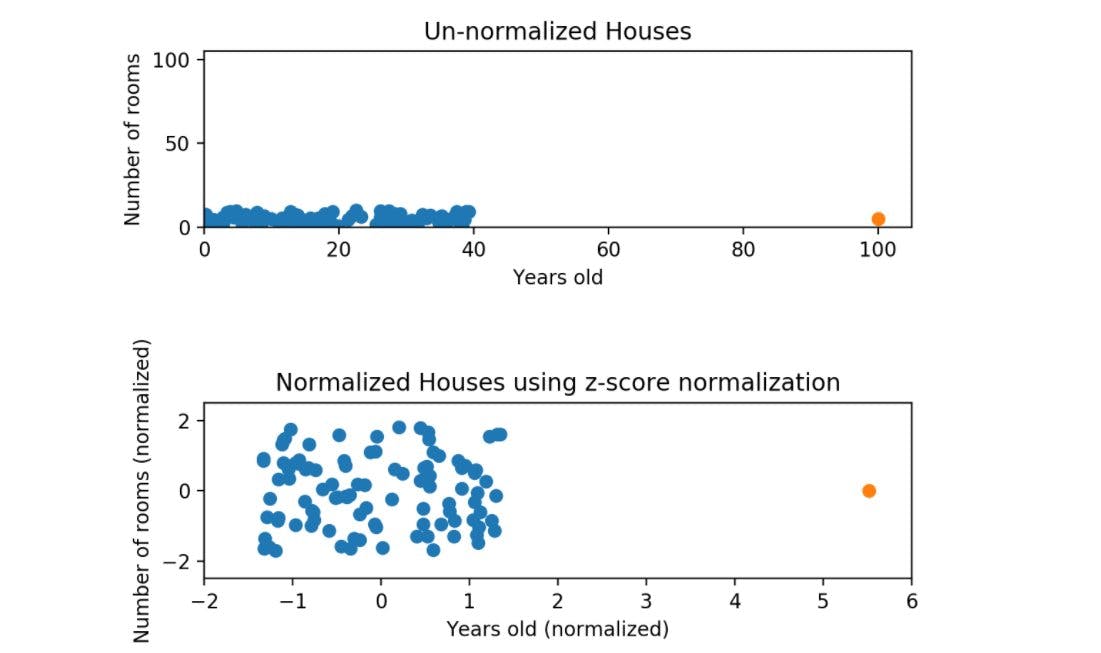
As already discussed, the goal of normalization is to make every datapoint have the same scale so each feature is equally important. So once we normalize our above data, the new graph should give a much better plot where the number of rooms will have equal weightage on the graph.
Here's the graph for house age v/s number of rooms now for comparison.

Again we can see that while the data is still squished, it is roughly on the same scale for both the features (between -2 and 2)
z-score in Python
Now that you understand what Z-score is, try to code it in Python and see how the z-score for your data looks like.
Syntax: scipy.stats.zscore(arr, axis=0, ddof=0)
Parameters : arr : [array_like] Input array or object for which Z-score is to be calculated. axis : Axis along which the mean is to be computed. By default axis = 0. ddof : Degree of freedom correction for Standard Deviation.
Here's a sample code snippet to demonstrate the syntax:
from scipy import stats

arr2 = [[70, 18, 9, 30, 14],
           [12, 11, 15, 24, 61]]

print ("\nZ-score for arr2 : \n", stats.zscore(arr2, axis = 0))
print ("\nZ-score for arr2 : \n", stats.zscore(arr2, axis = 1))
conclusion
As we can see in the above example, normalization of data is an important step of pre-processing our dataset. Otherwise, we might have an amazing dataset with many features but if one of those features dominates our dataset, it is equivalent to throwing away most of our information.
