


Pandas is a python module used for data manipulation, statistical analysis and more. In this post, we will go over some of the basic statistical methods in Pandas using the Covid19-India dataset
Since we have explored how to get started with exploring the dataset on Kaggle using the IPL dataset let us go ahead and see how to use the pandas inbuilt methods for statistics.
1. Load the data and fetch basic information about the dataframe
>>> covid = pd.read_csv('/kaggle/input/latest-covid19-india-statewise-data/Latest Covid-19 India Status.csv')
>>> covid.shape

(36, 8)
>>> covid.dtypes

State/UTs               object
Total Cases              int64
Active                   int64
Discharged               int64
Deaths                   int64
Active Ratio (%)       float64
Discharge Ratio (%)    float64
Death Ratio (%)        float64
dtype: object
2. Some basic information about the dataset
>>> covid.info()
<class 'pandas.core.frame.DataFrame'>
RangeIndex: 36 entries, 0 to 35
Data columns (total 8 columns):
 #   Column               Non-Null Count  Dtype
---  ------               --------------  -----
 0   State/UTs            36 non-null     object
 1   Total Cases          36 non-null     int64
 2   Active               36 non-null     int64
 3   Discharged           36 non-null     int64
 4   Deaths               36 non-null     int64
 5   Active Ratio (%)     36 non-null     float64
 6   Discharge Ratio (%)  36 non-null     float64
 7   Death Ratio (%)      36 non-null     float64
dtypes: float64(3), int64(4), object(1)
memory usage: 2.4+ KB
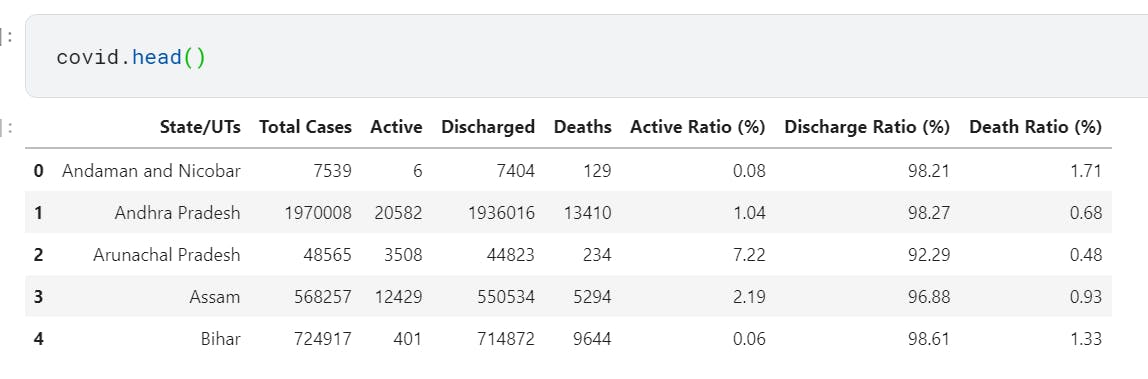
3. Get the first 5 rows of dataset
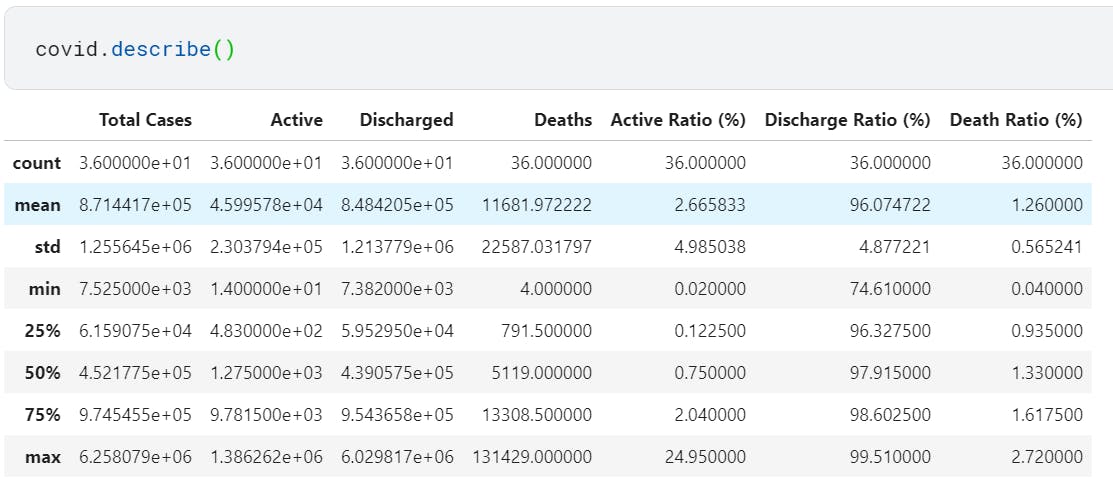
4. Statistics summary of dataset using describe()
5. Calculate min and max
- for the entire dataframe: covid.min()
- for a single column: covid['Discharged'].min()
>>> covid.min()

State/UTs              Andaman and Nicobar
Total Cases                           7539
Active                                   6
Discharged                            7404
Deaths                                   4
Active Ratio (%)                      0.02
Discharge Ratio (%)                  68.91
Death Ratio (%)                       0.04
dtype: object

>>> covid['Discharged'].min()
7404

>>> covid['Discharged'].max()
6103325
6. calculate mean
>>> # mean of each column
>>> covid.mean()

Total Cases            881291.861111
Active                  11248.833333
Discharged             858232.055556
Deaths                  11810.972222
Active Ratio (%)            2.679722
Discharge Ratio (%)        96.059167
Death Ratio (%)             1.261667
dtype: float64

>>> # mean of each row
>>> covid.mean(axis=1)

0     2.168286e+03
1     5.628737e+05
2     1.389000e+04
3     1.623734e+05
4     2.071334e+05
5     1.771714e+04
6     2.864309e+05
7     3.057143e+03
8     4.104146e+05
9     4.895571e+04
10    2.357063e+05
11    2.200017e+05
12    5.897686e+04
13    9.193571e+04
14    9.922086e+04
15    8.309526e+05
16    9.787209e+05
17    5.827143e+03
18    2.930571e+03
19    2.262606e+05
20    1.804318e+06
21    2.854914e+04
22    1.885400e+04
23    1.147457e+04
24    8.015429e+03
25    2.799391e+05
26    3.460257e+04
27    1.712034e+05
28    2.725011e+05
29    7.694286e+03
30    7.324554e+05
31    1.845849e+05
32    2.259314e+04
33    4.881571e+05
34    9.778514e+04
35    4.369557e+05
dtype: float64
7. Calculate median
>>> covid.median()

Total Cases            457740.000
Active                   1277.000
Discharged             446194.500
Deaths                   5211.500
Active Ratio (%)            0.670
Discharge Ratio (%)        98.035
Death Ratio (%)             1.320
dtype: float64
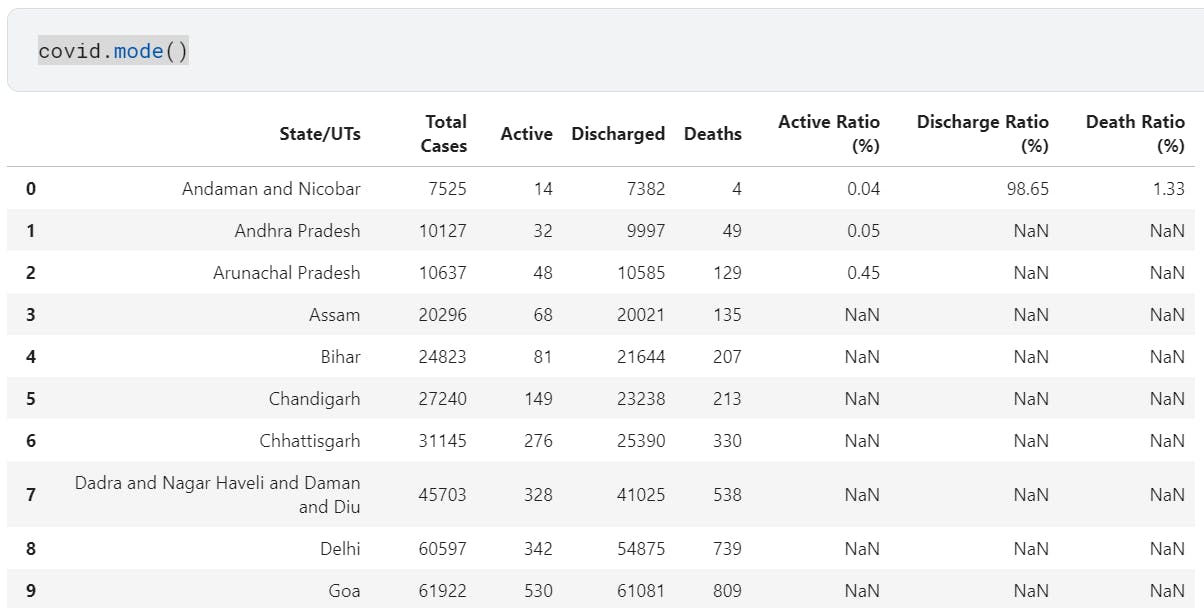
8. Calculate mode
9. Standard deviation
>>> # standard deviation
>>> covid.std()

Total Cases            1.273276e+06
Active                 2.995749e+04
Discharged             1.231874e+06
Deaths                 2.284218e+04
Active Ratio (%)       5.706423e+00
Discharge Ratio (%)    5.592844e+00
Death Ratio (%)        5.676040e-01
dtype: float64
10. Variance
>>> # variance
>>> covid.var()

Total Cases            1.621232e+12
Active                 8.974511e+08
Discharged             1.517514e+12
Deaths                 5.217650e+08
Active Ratio (%)       3.256326e+01
Discharge Ratio (%)    3.127990e+01
Death Ratio (%)        3.221743e-01
dtype: float64
That is it from my end, you can have a look at my public notebook here
If you liked my content, leave a like and/or comment. I will be posting many more such articles here so consider following here to stay updated.
I also share a lot of tech tips and tricks on Twitter so you can follow me there as well.
Happy coding !