Let us continue to explore the IPL dataset on Kaggle. First part to this series can be found here
Now that we know how to fetch basic properties of our csv or group our data, and fetch some meaningful values, let us see how to combine data properly in two dataframes.
Let's dive into pd.concat()
- used to concatenate dataframes along the rows or columns.
- takes list of dataframes to concatenate as input
- takes an optional argument
axisto specify whether to concatenate along rows or columnsaxisdefaults to 0, which means concatenate the rows.axis=1will concatenate the columns.
Let's look at some examples from the IPL dataset now
Let's load the csv file and see what columns it has
balldf = pd.read_csv('/kaggle/input/ipl-complete-dataset-20082020/IPL Ball-by-Ball 2008-2020.csv')
balldf.shape
balldf.dtypes

Interested to see the list of all the players who played?
batgrp = balldf.groupby('batsman')
batgrp.groups.keys()
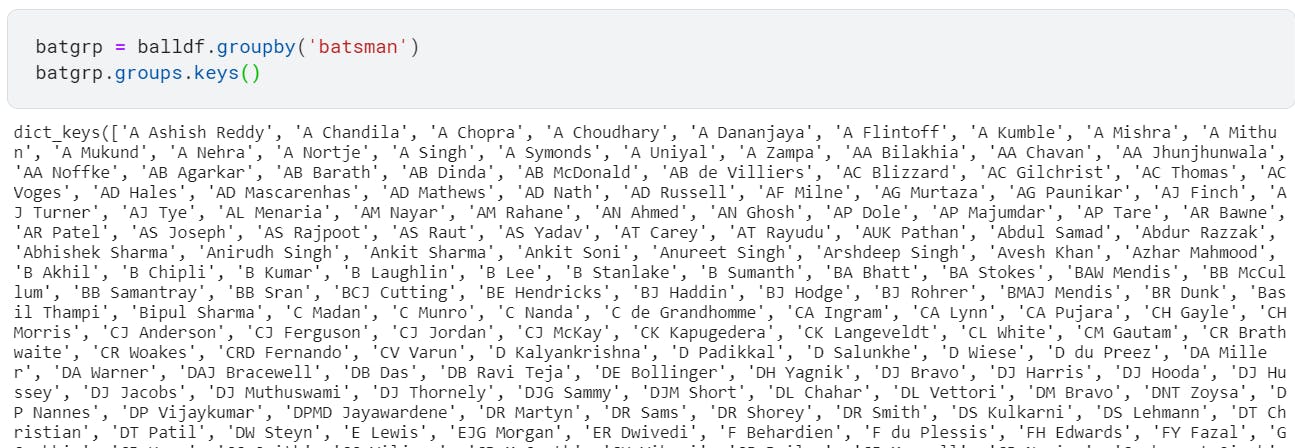
Let us fetch all the rows for Virendra Sehwag and Yuvraj Singh individually. Since we already grouped our data based on batsman, we can do get_group to get the data for any of the players now.
sehwag = batgrp.get_group('V Sehwag')
yuvraj = batgrp.get_group('Yuvraj Singh')
Here's how their individual dataframes look like
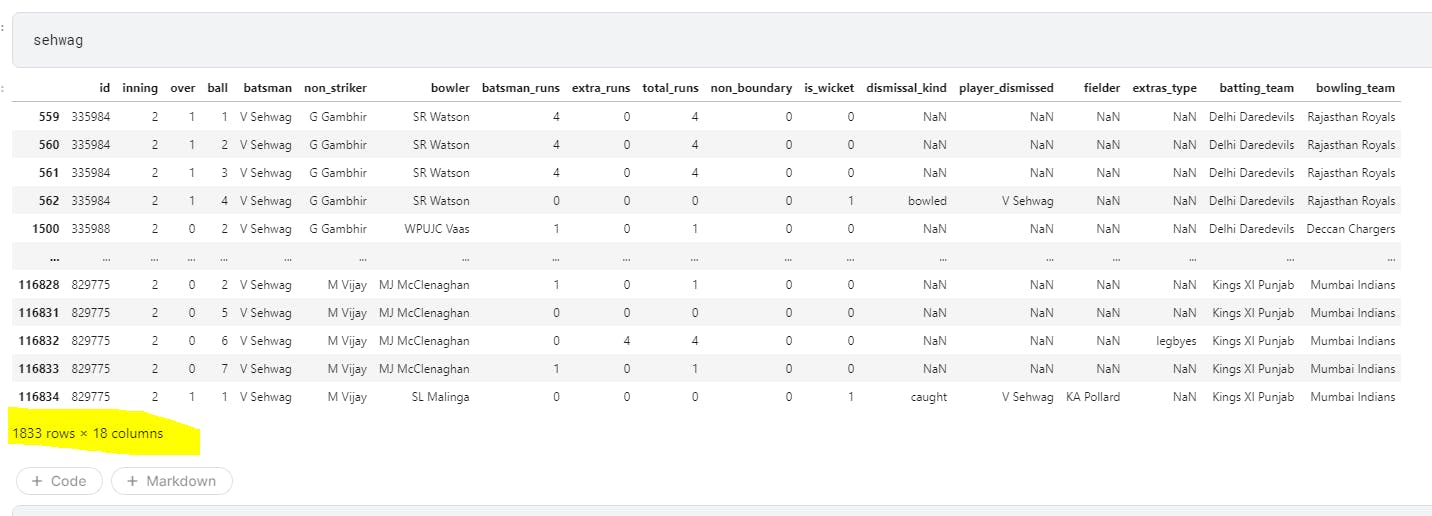
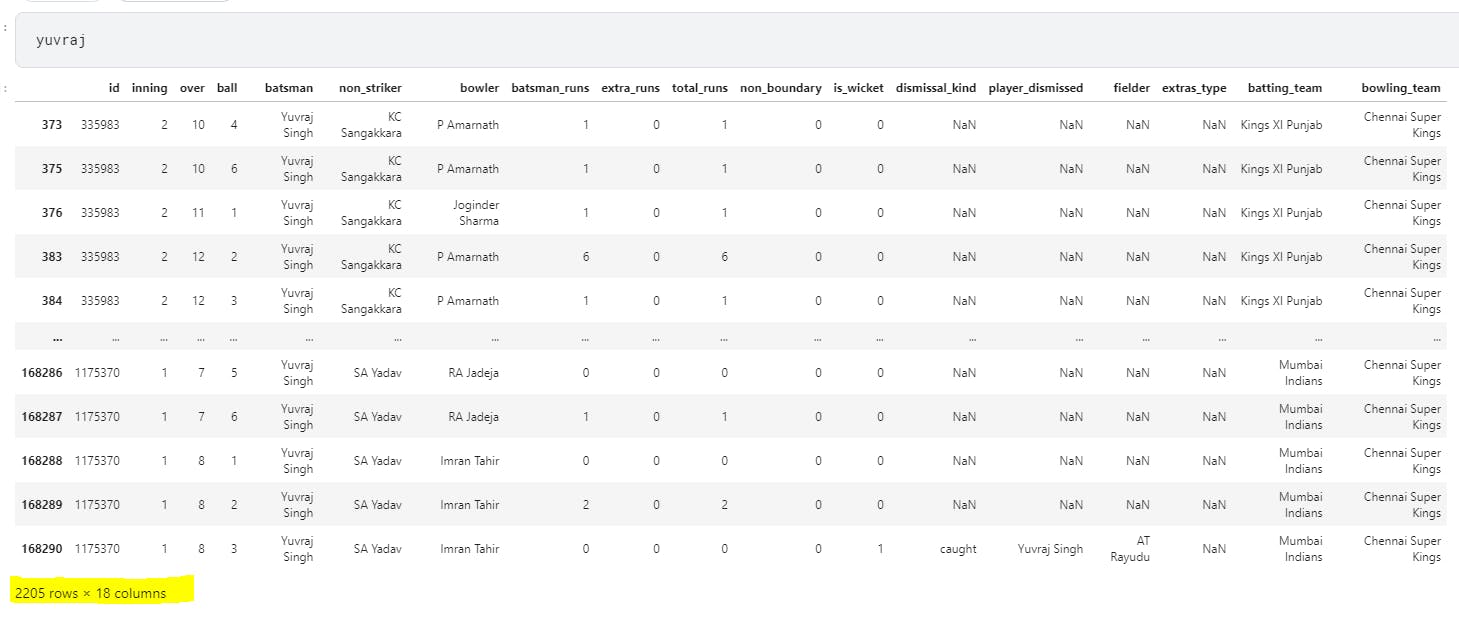
We can see here that Sehwag has 1833 rows while Yuvraj has 2205 rows. Let us now concatenate these two dataframes along the rows and columns and see what our new dataframe looks like.
1. Concatenate the rows
When we concatenate the two dataframes along the rows, we can see that now the resultant dataframe has 1833 + 2205 = 4038 rows, each with 18 columns.
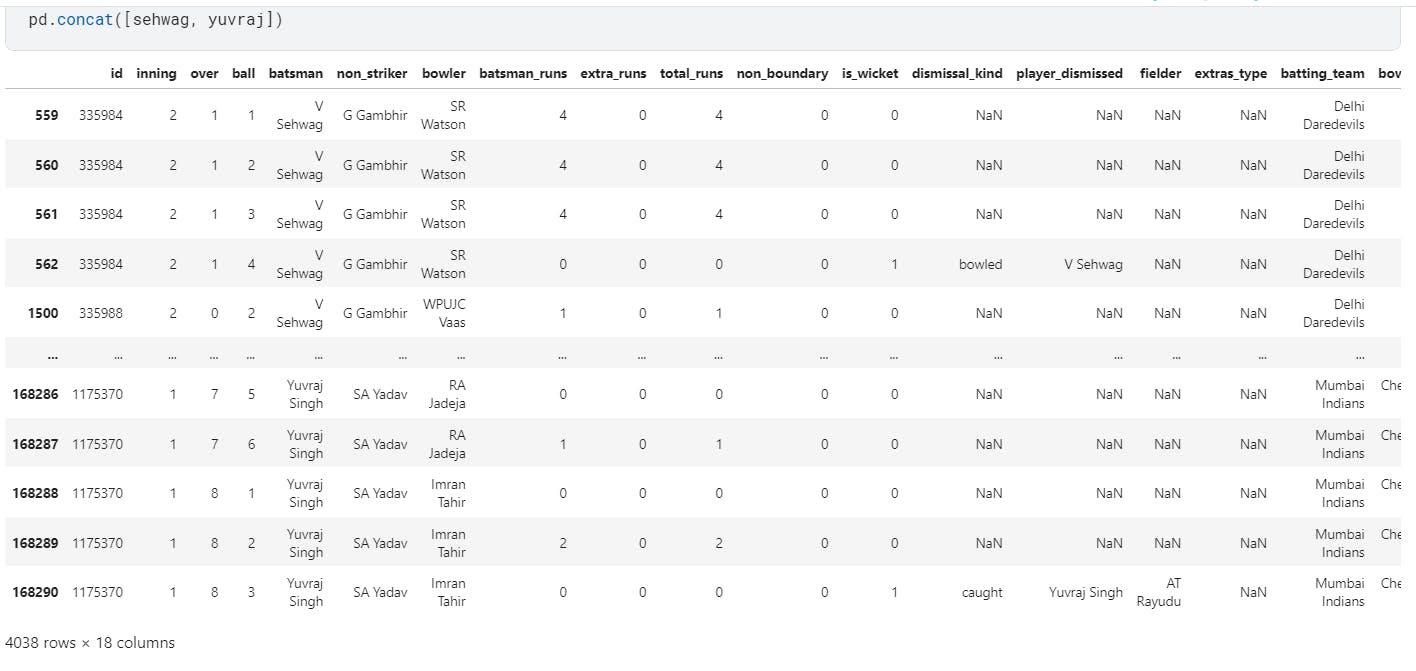
If the two dataframes have different number of columns, the missing values will get filled by NaN (not a number)
df1 = pd.DataFrame({'c1':[1,2], 'c2':[3,4], 'c3':[5,6]},
                   index=['r1','r2'])
df2 = pd.DataFrame({'c1':[5,6], 'c2':[7,8]},
                   index=['r1','r2'])
pd.concat([df2, df1])

    c1  c2   c3
r1   5   7  NaN
r2   6   8  NaN
r1   1   3  5.0
r2   2   4  6.0
2. Concatenate the columns
To concatenate the data along the columns, we need to mention axis=1
Note here that the row labels in both the dataframes are the same.
df1 = pd.DataFrame({'c1':[1,2], 'c2':[3,4], 'c3':[5,6]},
                   index=['r1','r2'])
df2 = pd.DataFrame({'c1':[5,6], 'c2':[7,8]},
                   index=['r1','r2'])
pd.concat([df1, df2], axis=1)

    c1  c2  c3  c1  c2
r1   1   3   5   5   7
r2   2   4   6   6   8
We can see here that now there are total 2 rows with 5 columns (3 columns from df1, 2 columns from df2). The column index remains the same as what was in the original dataframes.
Now let's see what happens if the row labels are different in both dataframes
df1 = pd.DataFrame({'c1':[1,2], 'c2':[3,4], 'c3':[5,6]},
                   index=['r1','r2'])
df2 = pd.DataFrame({'c1':[5,6], 'c2':[7,8]},
                   index=['r3','r2'])
pd.concat([df1, df2], axis=1)
     c1   c2   c3   c1   c2
r1  1.0  3.0  5.0  NaN  NaN
r2  2.0  4.0  6.0  6.0  8.0
r3  NaN  NaN  NaN  5.0  7.0
Tricks to use concat() efficiently.
1. Ignore the index values
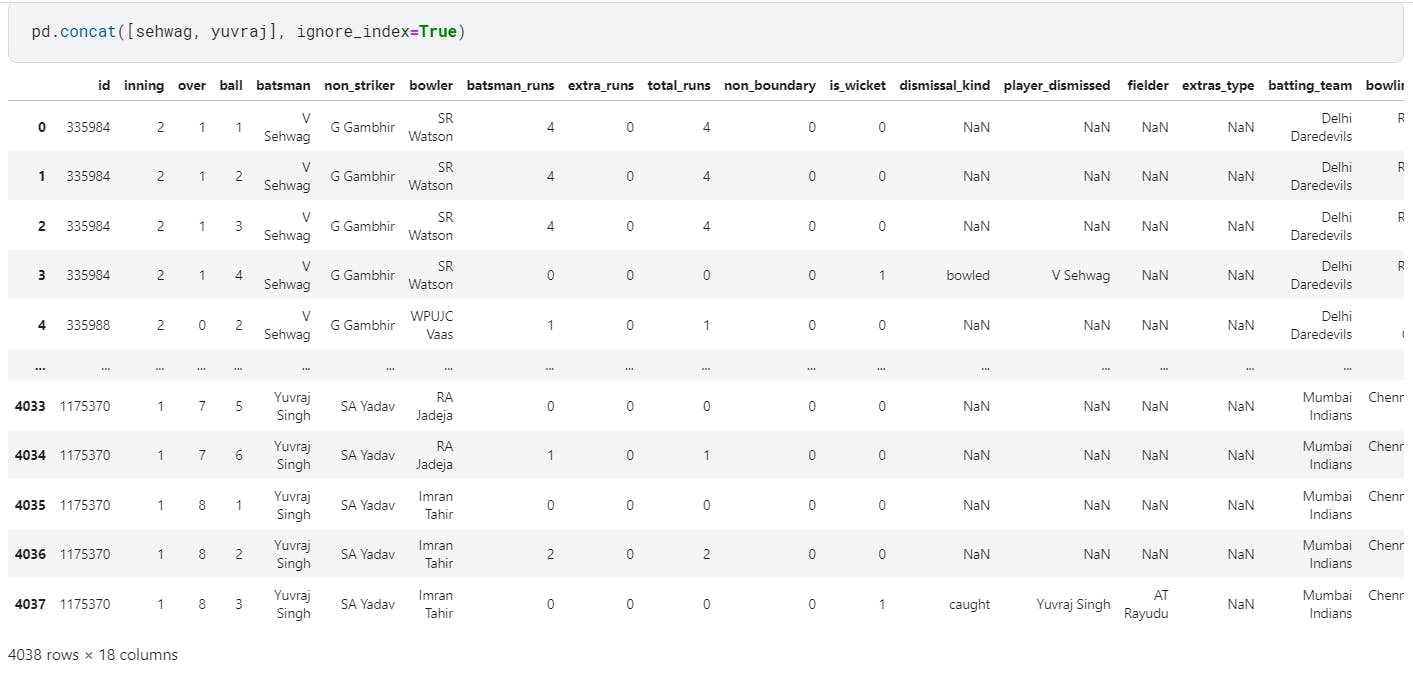
In the above example where we had concatenated dataframes sehwag and yuvraj along the rows, we could see that the rows had their original row indices. We can give optional argument ignore_index=True so that the original indices are ignored. Then, the new DataFrame index will be labeled with 0, …, n-1
2. Avoid duplicate index
If we want to maintain integrity and want to avoid having rows with duplicate index, we use the optional argument verify_integrity=True. When this value is True, pd.concat() will throw error if there are duplicate indices.
df1 = pd.DataFrame({'c1':[1,2], 'c2':[3,4], 'c3':[5,6]},
                   index=['r1','r2'])
df2 = pd.DataFrame({'c1':[5,6], 'c2':[7,8]},
                   index=['r3','r2'])
pd.concat([df2, df1], verify_integrity=True)

Traceback (most recent call last):
  File "main.py", line 15, in <module>
    concat = pd.concat([df2, df1], verify_integrity=True)
  File "/usr/local/lib/python3.5/dist-packages/pandas/core/reshape/concat.py", line 212, in concat
    copy=copy)
  File "/usr/local/lib/python3.5/dist-packages/pandas/core/reshape/concat.py", line 363, in __init__
    self.new_axes = self._get_new_axes()
  File "/usr/local/lib/python3.5/dist-packages/pandas/core/reshape/concat.py", line 443, in _get_new_axes
    new_axes[self.axis] = self._get_concat_axis()
  File "/usr/local/lib/python3.5/dist-packages/pandas/core/reshape/concat.py", line 500, in _get_concat_axis
    self._maybe_check_integrity(concat_axis)
  File "/usr/local/lib/python3.5/dist-packages/pandas/core/reshape/concat.py", line 509, in _maybe_check_integrity
    '{overlap!s}'.format(overlap=overlap))
ValueError: Indexes have overlapping values: ['r2']
3. Add multi-level index
We can add a hierarchical index using the keys keyword.
pd.concat([sehwag, yuvraj], keys=['Sehwag', 'Yuvraj'])

That’s it
Thanks for reading. Please check out the notebook for the source code.
Stay tuned if you are interested to learn ML related Python libraries and practical aspect of machine learning.
