IPL Data Analysis using Python and Pandas
Using Pandas to understand and explore the IPL dataset available on Kaggle.
Cricket is a very popular sports in India and the IPL dataset on Kaggle seemed like a good candidate to explore what I learnt.
Let's get started.
We can choose to download the csv files from kaggle or explore the dataset using Kaggle notebook. The screenshots shared here is all from the kaggle notebook.
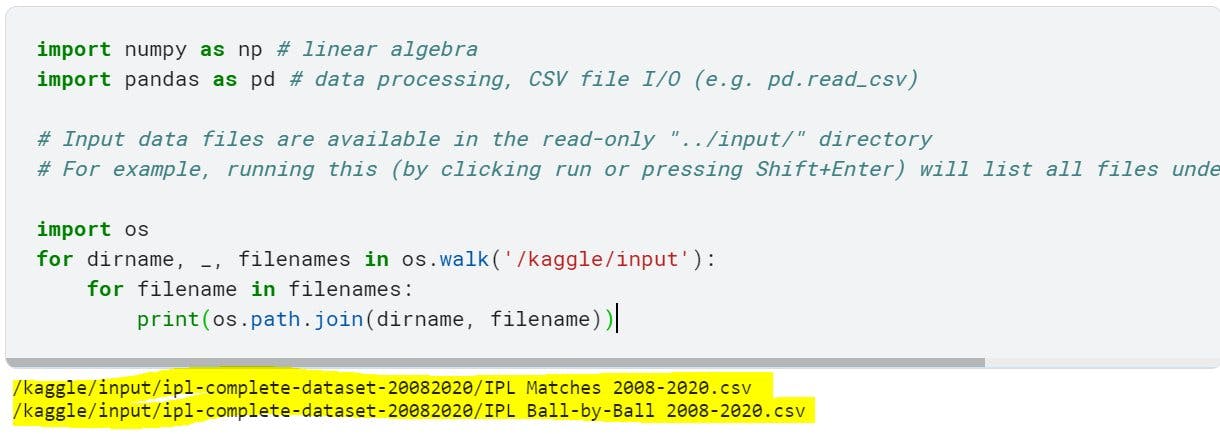
Step 1: Find complete path of the csv files in dataset
When we open a fresh notebook from the dataset page, the code to print full path of the csv files is already present that we can directly run.

Step 2: Load the data
Now that we have the complete path to the csv, we will use read_csv method of pandas to load the data to a dataframe (ie. a 2D array)
df = pd.read_csv('/kaggle/input/ipl-complete-dataset-20082020/IPL Matches 2008-2020.csv')
print(df)

Step 3: Fetch dataset basic attributes
Let's fetch the basic info about the dataset like number of rows, columns, datatype of each column.
shapeattribute will give us the number of rows and columnsdtypeswill give us the datatype of each column
df.shape
df.dtypes

From the above output, we can see that our data has 816 rows and 17 columns. Also the complete output for df.dtypes actually has 17 lines, one for each column.
Step 4: Analyze the data
Let us now try to analyse the data to make more sense. We will look at all the columns that our dataset has and see which of them make sense to us for whatever we are trying to achieve.
1. Check how many matches were played in Bangalore.
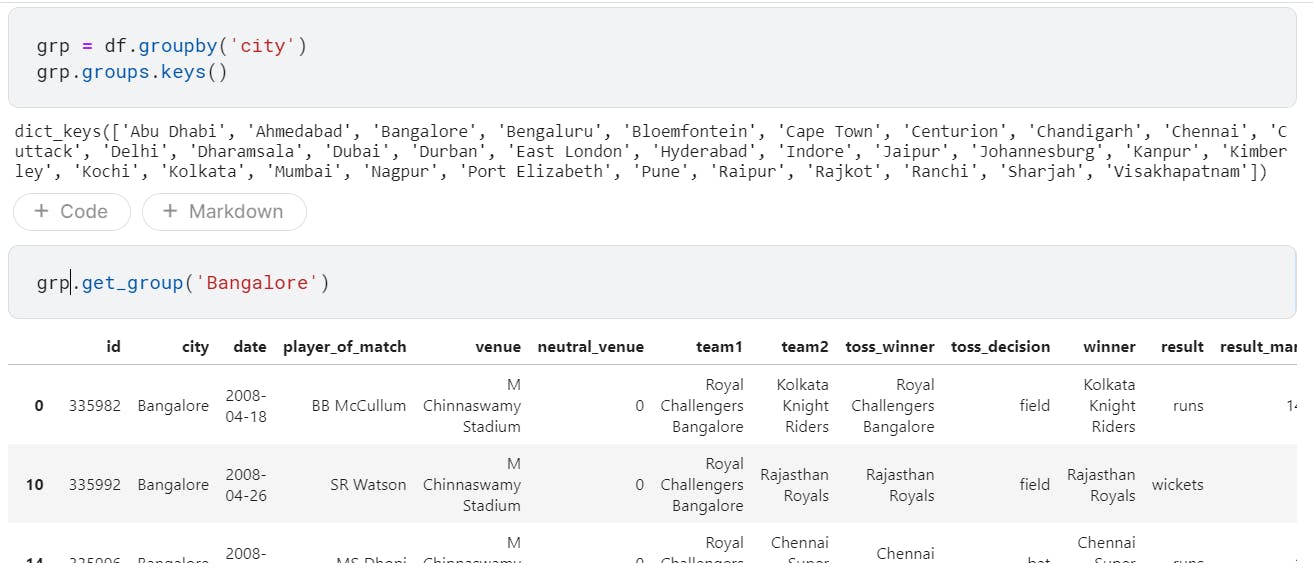
Let us try to group up our data based on the city the match was played in.
groupbywill group data based on column.groupsfeature returns dict of grouped DFs.get_groupreturns DF corresponding to the key.
Here we print the list of cities in our dataset using groups.keys() feature.
grp = df.groupby('city')
grp.groups.keys()
grp.get_group('Bangalore')

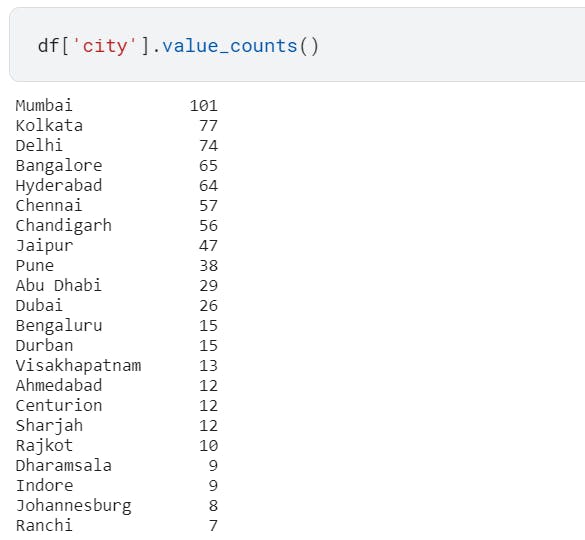
2. Check how many matches were played in each city
Now that we have grouped our data based on city, let us find the count of match played in each city.
- `value_counts` to get count of match per city
- Return a Series containing counts of unique values
- The resulting object will be in descending order
df['city'].value_counts()

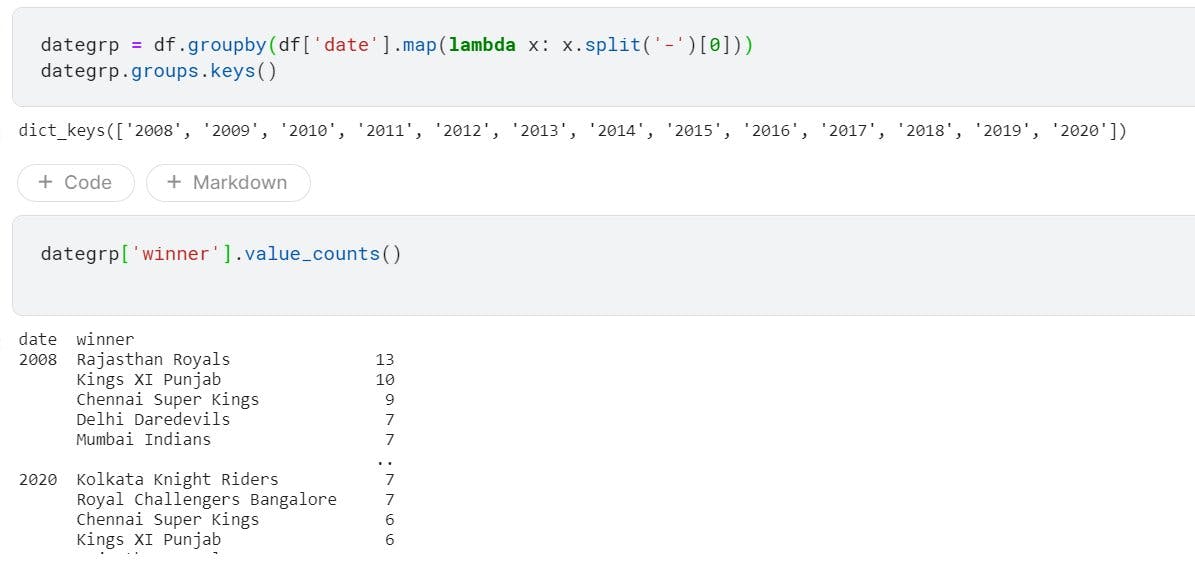
3. Match winner of each season
- To find the winner of each season, we first need to group our data based on the year
- We need to first fetch year from
dateand then check which team won most matches in each season
dategrp = df.groupby(df['date'].map(lambda x: x.split('-')[0]))
dategrp.groups.keys()
dategrp['winner'].value_counts()

There's a lot more that can be explored in the IPL dataset, but here I have covered the basics for beginners to get started. There will be more articles in the future exploring more pandas features.
Happy coding. Cheers !
