Heartbeat: Python module to visualize code
Visual representation of how often line of code gets called in Python program.
'heartbeat' module in Python 3 (Supports Python 3.5+) can be used to visualize which lines of code get called how many times during our program execution.
Installation
$ pip3 install heartrate
How to call heartrate in program
import heartrate
heartrate.trace(browser=True)
Recursive program to calculate Fibonacci
import heartrate
heartrate.trace(browser=True)

# Function for nth Fibonacci number
def Fibonacci(n):
    # First Fibonacci number is 0
    elif n==0:
        return 0
    # Second Fibonacci number is 1
    elif n==1:
        return 1
    else:
        return Fibonacci(n-1)+Fibonacci(n-2)

# Driver Program
print(Fibonacci(9))
Executing the program
$ python3  fib.py
 * Serving Flask app 'heartrate.core' (lazy loading)
 * Environment: production
   WARNING: This is a development server. Do not use it in a production deployment.
   Use a production WSGI server instead.
 * Debug mode: off
34
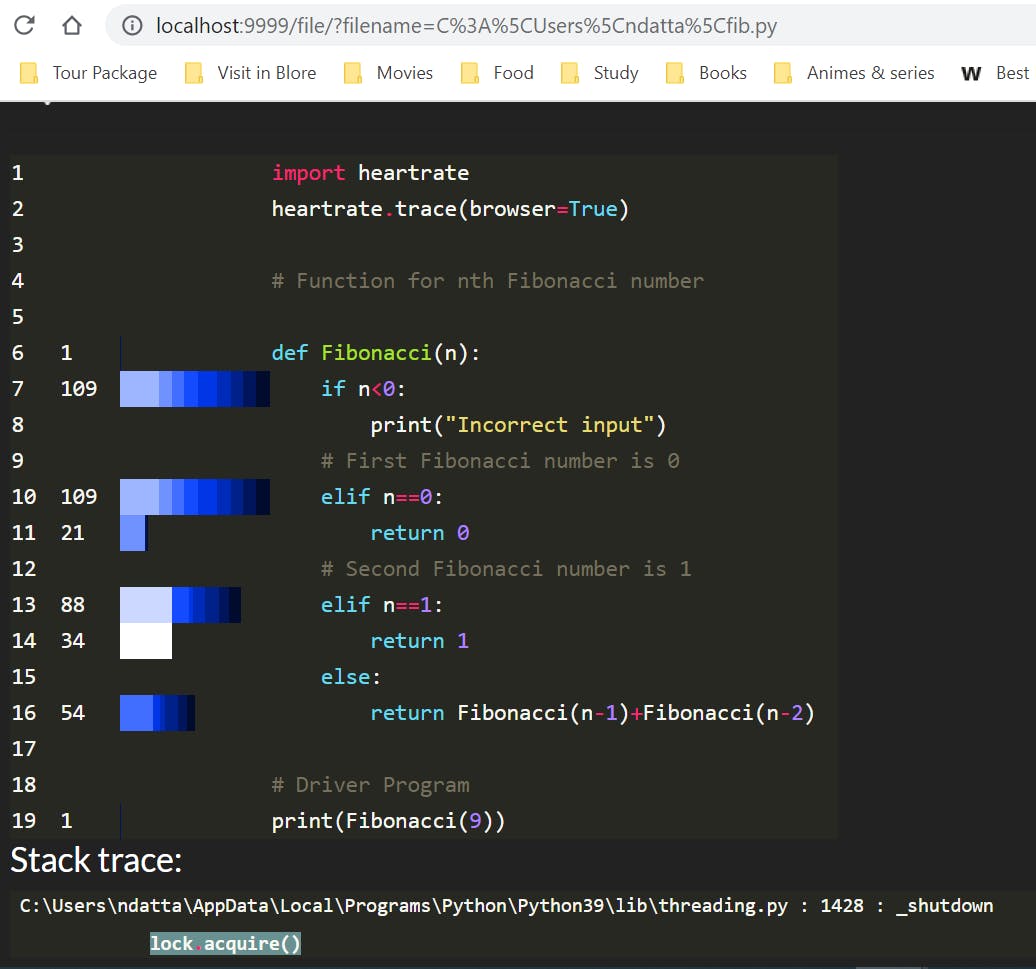
On executing the above program, it will open a browser window displaying the visualisation of the file where trace() was called.
url on my browser
http://localhost:9999/file/?filename=C%3A%5CUsers%5Cndatta%5Cfib.py
The above url was opened on my browser where I could see the stacktrace and a visual representation of how frequently different line of code was getting called.
Here's a screenshot of how it looked for me.
 Reference: github.com/alexmojaki/heartrate

